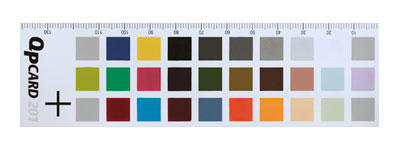
QPcard™ 201
The QPcard™ 201 is a color chart for calibrating and profiling digital cameras.
Description
The QPcard™ 201 consists of 30 squares of ink applied to a paper substrate in 3 rows of 10 patches. There are 27 unique colors, with the four corner patches consisting of the same gray color. There is a 7 step grayscale. As shown, patches are numbered by rows starting with the upper-left patch. The grayscale occupies patches 4 through 10, inclusive.
The QPcard™ 201 is 140 mm x 41 mm (5.5 x 1.625 in.). A millimeter ruler is printed along one edge. There is an adhesive strip on the back on the side with the ruler, covered with a removable plastic film.

Notes
The ink appears to be silk screen printed onto the substrate.
The paper substrate contains a fluorescent brightener but it does not appear to effect the patches.
The paper substrate is not opaque, making the choice of the backing very important since it can be expected to influence the patches.
Data
| CIE 1976 L*a*b*, D50, 2° | |||
|---|---|---|---|
| Name | L* | a* | b* |
| Patch 1 |
76.62
|
-0.32
|
1.17
|
| Patch 2 |
34.39
|
3.38
|
-39.64
|
| Patch 3 |
85.21
|
1.91
|
80.13
|
| Patch 4 |
25.28
|
0.30
|
0.20
|
| Patch 5 |
39.61
|
-0.06
|
0.34
|
| Patch 6 |
48.95
|
-0.58
|
-0.60
|
| Patch 7 |
65.02
|
-0.28
|
0.85
|
| Patch 8 |
86.61
|
-0.03
|
1.60
|
| Patch 9 |
94.98
|
-0.14
|
1.96
|
| Patch 10 |
76.70
|
-0.21
|
1.36
|
| Patch 11 |
73.39
|
-17.27
|
72.02
|
| Patch 12 |
58.11
|
-48.93
|
16.68
|
| Patch 13 |
51.97
|
55.96
|
3.61
|
| Patch 14 |
28.02
|
9.70
|
-6.20
|
| Patch 15 |
42.14
|
-14.19
|
20.08
|
| Patch 16 |
53.64
|
1.13
|
40.59
|
| Patch 17 |
38.57
|
13.53
|
14.02
|
| Patch 18 |
65.51
|
17.21
|
17.88
|
| Patch 19 |
85.68
|
-8.33
|
-1.25
|
| Patch 20 |
79.55
|
8.69
|
-8.58
|
| Patch 21 |
76.43
|
-0.21
|
1.45
|
| Patch 22 |
36.37
|
48.66
|
22.67
|
| Patch 23 |
53.39
|
-24.00
|
-37.20
|
| Patch 24 |
32.77
|
28.23
|
7.78
|
| Patch 25 |
49.48
|
-5.17
|
-21.91
|
| Patch 26 |
64.38
|
48.48
|
63.30
|
| Patch 27 |
78.44
|
25.51
|
83.94
|
| Patch 28 |
87.71
|
9.10
|
27.71
|
| Patch 29 |
87.43
|
-4.90
|
14.43
|
| Patch 30 |
76.68
|
-0.28
|
1.61
|
Two charts were measured and averaged for the table data. The measurements were made with a GretagMacbeth Spectrolino® equipped with a D65 filter. A black backing was used behind the charts. The spectral data was acquired, averaged and analyzed with SpectraShop™ 2.
Updated 11.4.2007
Back to Color Information table
